Valuing gold stocks – we start with Barrick Gold

Thank heavens for Brexit. For a moment there, it was looking as though Yellen had painted herself into a corner and might actually have had to raise rates. Now with Brexit, we clearly need MOAR monetary stimulus from central banks, notwithstanding the real problems being kept at bay relate more to the rotten state of the European banking industry and governments inability to wean themselves off debt monetisation. The pretence that anything has been fixed since 2008 and that there could be a return to sound money is being increasingly exposed and with it we’ve seen a renewed interest in the original hard currencies of gold and silver. Depending on the individual tax situation, an investor has three basic ways of investing in these. The first is to buy and take physical delivery and store it somewhere safe where thieves and Governments can’t steal it. The second is to buy a piece of paper which says ‘Gold’ on it and hope that the issuing institution hasn’t already stolen it. Lastly, one can buy a share of a company that actually mines and refines the stuff. The latter can always lie about their ‘proven’ reserves, prospective extraction costs and hidden off balance sheet liabilities, but for the larger operators at least, where more eyes are on them and their assets, one might have greater security, particularly when the most of the assets are located in North America, as is the case for Barrick Gold. While a financial institution might co-mingle its client assets with its own, when the gold is still co-mingled with the bank of mother earth, it’s a little less easy for management to run off with it.
Barrick Gold Corp (ABX)
We are therefore extending our coverage in extractive industries to include gold miners. To start this we are today initiating coverage in our GrowthRater of the World’s largest gold miner, the Barrick Gold Corporation (ABX)
Valuation challenge
Gold miners such as Barrick present an interesting valuation challenge. The business model is asset intensive, but returns are largely subject to a key variable, the gold price, over which management has no control and unfortunately, as with the oil industry, has a very poor record of predicting. As a consequence, a returns vs asset type model is unlikely to yield much insight on future marginal returns on re-investing excess FCF, particularly if trying to extrapolate historic performances. For Barrick that would mean including over $33bn of impairment and exceptional write-downs taken over the last decade, which would take invested capital up to over $48bn. With projected current year adjusted EBITDA at under $4bn, this suggests a gross cash return of less than 10% and possibly a net return of less than 3%, if these were to be amortised over the remaining life of the reserves at the current rate of extraction. Clearly, if one were to base an opportunity value on the management’s past performance in earning an excess return on its capital, one might as well be including a discount rather than a premium.
A growth based perspective
Using the normalised OpFCF yield and implied growth rating analysis from the GrowthRater provides a slightly clearer picture of the valuation trends, particularly when matched against our estimate for the group’s organic revenue growth, as can be seen below. If this seems a bit too esoteric, don’t fret as we also use a reserves based reality check to validate these conclusions.
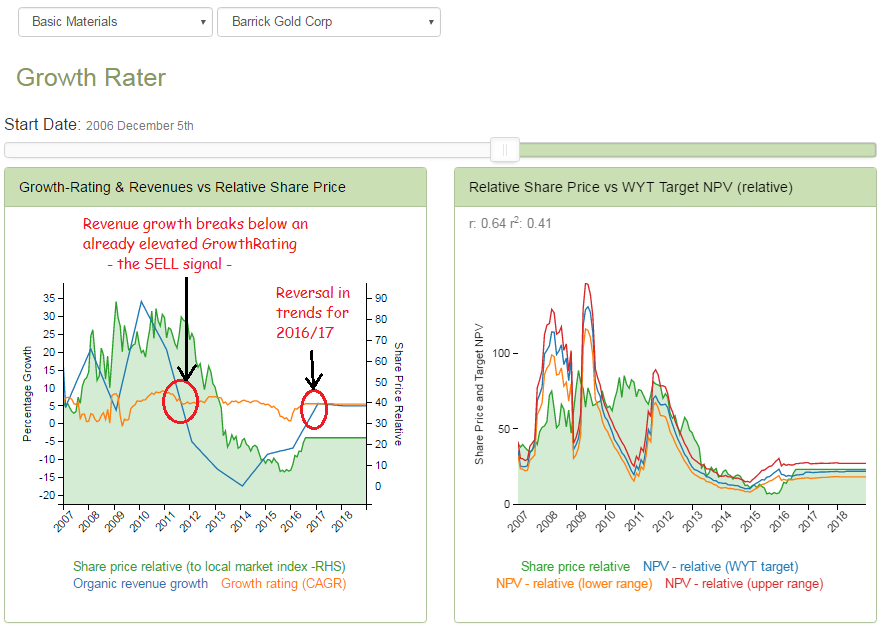
GrowthRater valuations capture implied growth and momentum relative to organic revenue growth
A reserves based valuation
Barrick Gold is enormously helpful to the investor by providing the key data needed for a simple reserves based valuation analysis. Indeed, so simple and aligned to the share price that I can only assume that analysts have returned their expensive HOLT subscriptions and are using something similar to the below table. With the historic returns data unreliable to assess an opportunity value or cost on reinvesting capital, a new investor is unconcerned about the price the company originally paid for the mine, and is more interested in the net present value of what is already proven to be in the ground.
In the below analysis I have taken 3 key data points from the company for both its gold and copper mining activities which can be used for a rough and ready valuation of its reserves. These are firstly the level of proven reserves, then the prospective current year extraction rate and lastly the current prospective cash costs of extraction. Include the current market prices for both Gold and Copper to arrive at the average cash returns and then discount at our equity market ECC and one can arrive at an NPV for both its gold and copper reserves. You will probably have noted that tax is not included. This is because the gross NPV is below the level of invested capital and based on the pre-capital costs and not against the AISC (all in sustaining costs) basis.
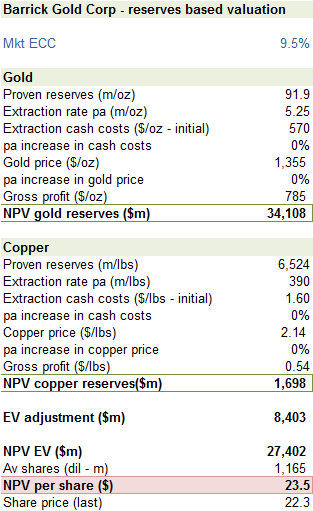
Valuing the NPV of proven reserves
Valuation sensitivity matrix
Excluded from the above analysis is any assumption for future price movements for Gold or Copper or change in extraction costs which one might assume would rise on a unit basis as mines near exhaustion. What is immediately apparent however is not only how close the calculated NPV is to the current market price of Barrick when the current gold and copper prices are included, but also the proximity of last year’s share price was when gold realised prices were around $1,157/oz and cash extraction costs were just under $600/oz as can be seen on the below sensitivity matrix. This includes copper reserves at the $1.446bn as per the above table and flexes the overall group NPV per share on the two key variables for gold, the price and the cash extraction costs.
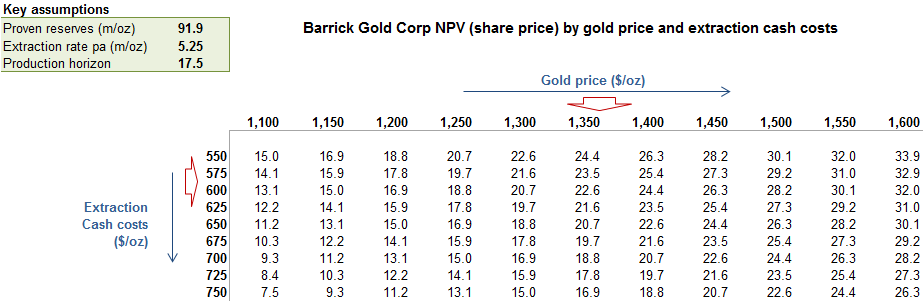
Select your gold price and see the reserves NPV per share
Full details on Barrick Gold and our other coverage stocks can be found in our Analytics section at: https://app.growthrater.com/